
Halloween candy statistics show just how big (and expensive) spooky-season treating has become—spanning billions in seasonal candy sales, shifting preferences from chocolate to gummies, and record-setting holiday budgets that keep candy bowls full.
Halloween Candy Statistics (Top Highlights)
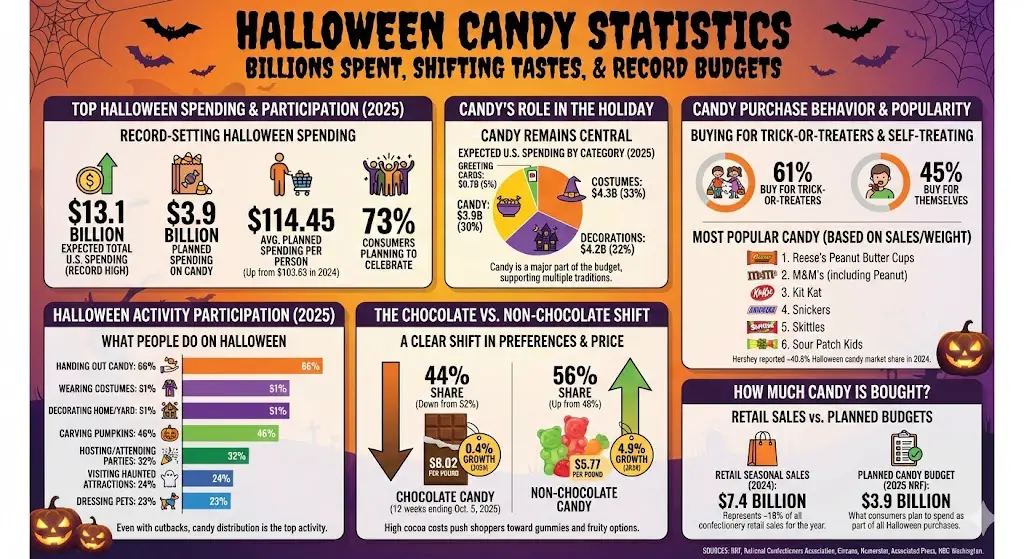
- U.S. Halloween spending was expected to reach a record $13.1 billion in 2025 (NRF consumer survey).
- Planned U.S. spending on candy alone for Halloween 2025 was expected to hit $3.9 billion (NRF).
- Average planned Halloween spending per person was $114.45 in 2025, up from $103.63 in 2024 (NRF).
- 73% of consumers planned to celebrate Halloween in 2025 (NRF).
- Top Halloween activity: 66% planned to hand out candy in 2025 (NRF).
- Americans spent about $7.4 billion on Halloween candy in 2024, representing 18% of all confectionery retail sales (National Confectioners Association figures reported in major news coverage).
- In the 12 weeks ending Oct. 5, 2025, chocolate was 44% of Halloween candy sold, down from 52% the prior year (Circana figures reported in major news coverage).
- Average price per pound (12 weeks ending Oct. 5, 2025): $8.02 for chocolate vs $5.77 for non-chocolate (Circana figures reported in major news coverage).
- Non-chocolate candy dollar sales grew 4.9% in 2024, while chocolate grew 0.4% (National Confectioners Association figures reported in major news coverage).
- Among Halloween celebrators, 81% planned to purchase candy (Numerator survey, 2025).
Halloween Spending Trend (How Candy Fits Into the Total)
Halloween budgets matter for candy because higher overall holiday spending usually means more households buying multiple bags (one for trick-or-treaters, one for parties, and one “mysteriously” disappearing at home).
| Year | Total Halloween spending (U.S., $B) | Avg. spend per person (U.S.) |
|---|---|---|
| 2025 | $13.1B (expected) | $114.45 (planned) |
| 2024 | $11.6B (expected) | $103.63 (planned) |
| 2023 | $12.2B (expected) | $108.24 (planned) |
Chart: Expected U.S. Halloween Spending by Category (2025)
| Label | Bar | Value |
|---|---|---|
| Costumes | $4.3B | |
| Decorations | $4.2B | |
| Candy | $3.9B | |
| Greeting cards | $0.7B |
Max = 4.3. Widths: Costumes 100.00%, Decorations 97.67%, Candy 90.70%, Greeting cards 16.28%.
How Much Candy Is Bought for Halloween?
There are two common ways candy totals get reported, and they answer different questions:
- Survey-based Halloween budgets (example: NRF) estimate what people plan to spend on candy as part of all Halloween purchases.
- Retail seasonal candy sales (example: confectionery industry figures reported by major outlets) describe how much candy was actually purchased during the Halloween season.
Using retail sales-style reporting, Americans spent about $7.4 billion on Halloween candy in 2024—roughly 18% of total confectionery retail sales for the year. Another retail-focused metric from Circana put U.S. household candy spending at about $4.5 billion in the four-week lead-up to Halloween (a window that captures the heaviest stock-up period).
What People Do on Halloween (Candy Still Leads)
Even when people cut back on decorations or costumes, candy stays central because it supports multiple traditions at once: trick-or-treating, parties, office bowls, and “self-treating.”
Chart: Share of U.S. Consumers Planning Each Halloween Activity (2025)
| Label | Bar | Value |
|---|---|---|
| Handing out candy | 66% | |
| Wearing costumes | 51% | |
| Decorating home/yard | 51% | |
| Carving pumpkins | 46% | |
| Hosting/attending parties | 32% | |
| Visiting haunted attractions | 24% | |
| Dressing pets | 23% |
Max = 66. Widths: Handing out candy 100.00%, Wearing costumes 77.27%, Decorating home/yard 77.27%, Carving pumpkins 69.70%, Hosting/attending parties 48.48%, Visiting haunted attractions 36.36%, Dressing pets 34.85%.
Chocolate vs. Non-Chocolate Candy (A Clear Shift)
High cocoa costs have been pushing shoppers toward gummies, fruity candy, and other non-chocolate options. In the 12 weeks ending Oct. 5, 2025, chocolate’s share of Halloween candy sold fell to 44% (down from 52% the prior year), alongside a noticeable price gap: about $8.02 per pound for chocolate vs $5.77 per pound for non-chocolate.
That mix shift also shows up in growth rates: reported 2024 figures put non-chocolate dollar sales growth at 4.9%, compared with 0.4% for chocolate—suggesting consumers are still buying candy, but “trading” into lower-cost formats.
Most Popular Halloween Candy (What People Actually Reach For)
Popularity depends on how it’s measured (search interest, surveys, sales weight, or retailer data), but chocolate staples still dominate most lists.
- Reese’s (including Reese’s Peanut Butter Cups) frequently appears as a top Halloween candy in retailer and media roundups based on sales/weight measures.
- Other recurring top-tier candies include M&M’s (including Peanut M&M’s), Kit Kat, Snickers, Skittles, and Sour Patch Kids.
- Brand concentration is significant in seasonal assortments: reported industry figures put Hershey at about 40.8% Halloween candy market share in 2024.
Self-Treating and Buying for Trick-or-Treaters
Halloween candy isn’t just for kids at the door. Reported consumer figures show many households buy candy for multiple reasons—handouts, parties, and personal snacking—helping explain why candy sales build for weeks before Oct. 31.
- 61% of U.S. consumers bought candy for trick-or-treaters (reported by Hershey in major news coverage).
- 45% reported buying Halloween candy for themselves (reported by Hershey in major news coverage).
Sources
- National Retail Federation (NRF) — “NRF Consumer Survey Finds Halloween Spending to Reach Record $13.1 Billion” (Press release, Sept. 18, 2025).
- NRF — Halloween Data & Trends (2025 survey highlights, including category spending and activities).
- Retail Dive — “Halloween spending to hit $11.6B this year: NRF” (Sept. 20, 2024).
- NRF — “Halloween Spending to Reach Record $12.2 Billion…” (Press release, Sept. 20, 2023).
- Associated Press — “Why trick-or-treaters may bag more gummy candy than chocolate…” (Oct. 25, 2025) (includes Circana and National Confectioners Association figures).
- Circana — “Unwrapping 2025 Halloween Candy Trends” (Oct. 31, 2025).
- Numerator — “81% of Consumers Celebrating Halloween Plan to Purchase Candy…” (Oct. 21, 2025).
- NBC Washington — “Here is the most popular Halloween candy in 2024” (Oct. 5, 2024) (CandyStore.com-based ranking coverage).